Spotlight is published twice each semester by the Office of Assessment and Continuous Improvement in the College of Education to highlight promising practices in assessment and continuous improvement. This edition of the Spotlight examines The SPARK testing method, Understanding ACE, and Portfolium.
College of Education Mission, Vision & Values
Mission Statement
To deliver a personal, affordable, and top-ranked education for students who want to collaborate with renowned faculty to solve problems and effect change in the field of education in our community, our country, and around the world.
Vision Statement
A world-class college of education: leading research, engaging our communities, and preparing education and mental health professionals for innovation and impact.
Values
- Equity
- Diversity and Inclusion
- Unrelenting Commitment to Communities
- Continuous Improvement and Innovation
- Anti-racist Action
- Teamwork and Collaboration
- Excellence and Integrity
In This Issue
Contributors
Prepared by Jeremy Penn with support from Michelle Yu and the Continuous Improvement Committee
To share a promising practice in a future edition of the Spotlight you are using in your classroom, in your program, or in your department, please contact jeremy-penn@uiowa.edu.
The SPARK (Spiraling Assessment to Reinforce Knowledge) Testing Method
By Kara Hageman, PhD
I created The SPARK (Spiraling Assessment to Reinforce Knowledge) Testing Method after observing my high school chemistry students perform well on tasks such as lab reports, practice problems, and projects and struggle on classroom tests year after year. The tendency for my colleagues to replace tests with other forms of assessment when students underperformed prompted me to enhance the testing experience in my college preparatory classes. After exhausting a variety of testing formats and designs, I used my familiarity with various learning theories to create SPARK.
SPARK is a complete redesign of the typical unit testing format. It includes a comprehensive component with a unique spiraling design. Students are tested weekly over newly learned content with low-level, knowledge-based questions. At the same time, students are tested over previously learned material with more cognitively demanding items. Throughout a semester, the tests evolve from recalling facts and concepts to making judgments and synthesizing information in different ways. The customizable design of SPARK supports research related to the testing effect, which suggests that testing is a memory-altering event superior to restudying learned material (Roediger & Karpicke, 2006b; Karpicke, 2017).
SPARK works, in part, by affording students with multiple opportunities to learn the foundational content needed to understand the material at a deeper level. Without duplicating items, the first few questions of each weekly test in an educational psychology course, for example, might pertain to the essential concepts of cognitive development before moving to items that require students to apply what they know or analyze relevant claims. As items related to a topic evolve linearly throughout the weekly format, the number of items on each weekly test increases with the addition of newly learned material. Repeating information within short periods of time rather than in a single event promotes storage in long-term memory (Brabeck et al., 2015). It also facilitates self-regulation by encouraging students to establish goals, monitor the progress of those goals, interpret feedback, and adjust goal-oriented actions. A simplified example of the spiraling format of item topics on the first four tests in an educational psychology class is shown in Figure 1 (below). In this example, two items related to newly learned material were added each week.
|
Week One |
Week Two |
Week Three |
Week Four |
|
Cognitive Development |
Cognitive Development |
Cognitive Development |
Cognitive Development |
|
Cognitive Development |
Cognitive Development |
Cognitive Development |
Cognitive Development |
|
|
Self, Social, and Moral Development |
Self, Social, and Moral Development |
Self, Social, and Moral Development |
|
Self, Social, and Moral Development |
Self, Social, and Moral Development |
Self, Social, and Moral Development |
|
|
|
Learning Differences |
Learning Differences |
|
|
Learning Differences |
Learning Differences |
||
|
|
Behavioral Views of Learning |
||
|
Behavioral Views of Learning |
To use SPARK as both a learning tool and an evaluative measure, it is necessary to identify the major topics, concepts, or objectives of a course for generating items. The number of items added each week and the pace at which the cognitive level of the items advances is at the discretion of the instructor. It is important to determine the cognitive tool that will be used to classify items and generate a robust item bank for each topic and level. For instance, items from the spiraling example assessing newly learned material included lower-level questions classified as remember, according to the revised version of the cognitive process dimension of Bloom’s taxonomy (Anderson & Krathwohl, 2001) as shown in Figure 2.
The classification of items related to previously learned material gradually increases on the cognitive hierarchy throughout the semester. Items from previous tests or textbook publishers can be revised to align with the SPARK design. Timely feedback on each weekly test is imperative for guiding each student’s self-regulatory process. Whether they seek assistance from the instructor or form a study group, the students need to be able to use the results of each test to monitor their own learning.
Research related to SPARK is ongoing. Studies conducted in an undergraduate educational psychology course and an 8th grade algebra I course revealed statistically significant differences favoring the classroom of students assessed with SPARK over those assessed with unit tests (Hageman, 2020). I am currently working with a group of researchers at Georgia State University on a study involving the use of SPARK in their interdisciplinary studies program. Future research includes studying the effects of SPARK in an undergraduate statistics course at Georgia State University.
References
Anderson, L. W., & Krathwohl, D. R. (Eds.). (2001). A Taxonomy for Learning, Teaching, and Assessing: A Revision of Bloom’s Taxonomy of Educational Objectives. New York, NY: Addison Wesley Longman, Inc.
Brabeck, M.M., Dwyer, C.A., Geisinger, K.F., Marx, R.W., Noell, G.H., Pianta, R.C., Subotnik, R.F., & Worrell, F.C. (2015). Assessing the assessments of teacher preparation. Theory Into Practice, 55(2), 160-167.
Hageman, K. (2020). Performance of 8th-grade algebra I students assessed with and without the SPARK testing method. (Publication No. 27959055) [Doctoral dissertation, University of Iowa]. ProQuest Dissertations Publishing.
Karpicke, J. D. (2017). Retrieval-based learning: A decade of progress. In J. T. Wixted (Ed.), Cognitive psychology of memory, Vol. 2 of Learning and memory: A comprehensive reference (J. H. Byrne, Series Ed.) (pp. 487-514). Oxford: Academic Press.
Roediger, H. L, & Karpicke, J. D. (2006). Test-enhanced learning: Taking memory tests improves long-term retention, Psychological Science, 17, 249-255.
College Data Tidbit
Understanding ACE (Ask, Consider, Engage): UI’s Student Survey of Instruction
ACE is the University of Iowa’s student survey of instruction. The College of Education began using new ACE questions in the spring of 2020, based on recommendations from a University of Iowa task force. Data on students’ responses on these new items are discussed below.
One issue identified by the University of Iowa ACE task force was the response rate. A summary of the response rate in each of the last 12 semesters is shown in Figure 1 below.
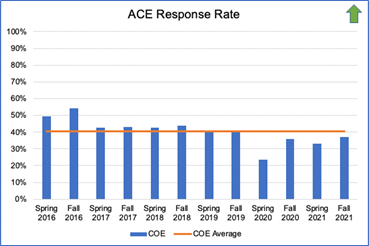
Unfortunately, the pandemic in spring 2020 depressed ACE response rates on all surveys, making it difficult to determine if the new ACE form improved response rates. However, response rates on ACE in fall 2021 (37.2%) continue to be below the College’s 6-year average of 40.5%. Response rates by department are available upon request.
Students’ average responses on the new ACE items (using a 1-6 scale) have been quite consistent over their four semesters of use in the College. For example, on the item “the instructor’s teaching methods helped students learn,” the average for the COE in spring 2020 was 5.39; in fall 2020 it was 5.40; in spring 2021 it was 5.40; and in fall 2021 it was 5.41. A similar pattern is observed with the item “the instructor communicated course material clearly,” with the 4-semester average varying by only 0.02 (from a high of 5.31 to a low of 5.29).
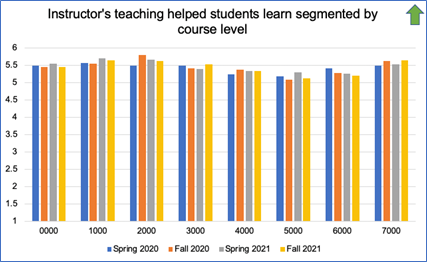
Disaggregating these results by course level show more variation in responses. For example, on the item “the instructor’s teaching methods helped students learn” (Figure 2), courses at the 1000- and 2000- level generally scored the highest (5.50 to 5.80) while courses at the 5000-level generally scored the lowest (5.10 to 5.19). It is unknown whether these differences truly reflect differences in teaching performance or whether they reflect differences on other factors, such as course structure, students’ expectations, student or instructor demographics, or others.
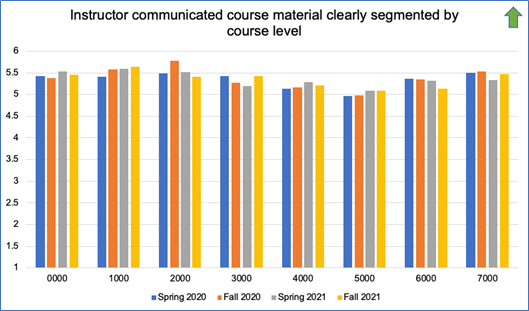
A similar pattern is seen for the item “the instructor communicated course material clearly” (Figure 3), with courses at the 5000-level generally receiving the lowest scores (4.96 to 5.09) and courses at the 1000- and 2000-level receiving the highest scores (5.41 to 5.77).
When examining student course evaluation surveys, it is important to remember that they are but one of point to consider regarding the quality of teaching and learning occurring in a course and may be subject to significant biases. Other important ways to examine the success of a course include assessment of student learning outcomes, students’ success in future courses in a course sequence, peer observations of teaching, and examination of teaching portfolios. The ACE task force also pointed out the importance of ongoing formative assessment during a semester using the ACE items or other methods to support the instructor’s ability to improve a class while it is still in session.
Figures (data tables)
Figure 1: A summary of the response rate in each of the last 12 semesters
|
Semester |
Rate |
|
Spring 2016 |
49.57% |
|
Fall 2016 |
54.40% |
|
Spring 2017 |
42.50% |
|
Fall 2017 |
43.20% |
|
Spring 2018 |
42.70% |
|
Fall 2018 |
44% |
|
Spring 2019 |
40% |
|
Fall 2019 |
40.20% |
|
Spring 2020 |
23.60% |
|
Fall 2020 |
35.89% |
|
Spring 2021 |
33.06% |
|
Fall 2021 |
37.20% |
|
Average: |
40.53% |
Figure 2: Student responses by course section and semester on the item “Instructor’s teaching helped students learn.”
|
Term |
0000 |
1000 |
2000 |
3000 |
4000 |
5000 |
6000 |
7000 |
|
Spring 2020 |
5.5 |
5.57 |
5.5 |
5.49 |
5.24 |
5.19 |
5.41 |
5.49 |
|
Fall 2020 |
5.45 |
5.55 |
5.8 |
5.41 |
5.38 |
5.1 |
5.28 |
5.63 |
|
Spring 2021 |
5.56 |
5.7 |
5.67 |
5.39 |
5.35 |
5.3 |
5.27 |
5.53 |
|
Fall 2021 |
5.45 |
5.64 |
5.62 |
5.53 |
5.35 |
5.12 |
5.2 |
5.64 |
Figure 3: Student responses by course section and semester on the item “Instructor communicated course material clearly.”
|
Term |
0000 |
1000 |
2000 |
3000 |
4000 |
5000 |
6000 |
7000 |
|
Spring 2020 |
5.42 |
5.41 |
5.49 |
5.43 |
5.14 |
4.96 |
5.36 |
5.5 |
|
Fall 2020 |
5.38 |
5.57 |
5.77 |
5.27 |
5.17 |
4.98 |
5.35 |
5.53 |
|
Spring 2021 |
5.53 |
5.59 |
5.52 |
5.19 |
5.28 |
5.08 |
5.31 |
5.34 |
|
Fall 2021 |
5.46 |
5.64 |
5.41 |
5.42 |
5.21 |
5.09 |
5.14 |
5.47 |
Promising Practice
Portfolium Tools Now Available as Pilot at the University of Iowa
The University of Iowa has purchased a license for Portfolium and is collaborating with programs on piloting use of Portfolium. Portfolium allows students to “create personal portfolios that they can share publicly” and supports the development of “course and program level portfolios that connect to ICON and can be used in student and departmental assessments”.
Portfolium is now owned by Canvas and a recent press release indicates many features of Portfolium will be integrated into Canvas in the future.
If your program has interest in exploring the features offered by Portfolium in more detail, please contact Jeremy Penn (Jeremy-penn@uiowa.edu) or the ITS help desk for more information.